Intro to using the Windows Debugger
Windows Debugger can be downloaded as part of the Windows SDK. I would install both the 32 and 64bit versions.
I used it in the past when diagnosing why a website was performing poorly during peak periods. Users would hit the website url, wait for 30+ seconds and then the site would appear quickly. Even the home page which did nothing (i.e. no db hits), was slow to appear.
I got a memory dump from the server and using the analysis approach below could see that all available IIS worker threads were in use and all were busy rendering. The server was starved of threads and user requests were ending up in a queue waiting to be processed.
I tweaked the IIS settings and added more worker threads. The problem went away. Thanks Windows Debugger!
2. Get the list of worker process ids:


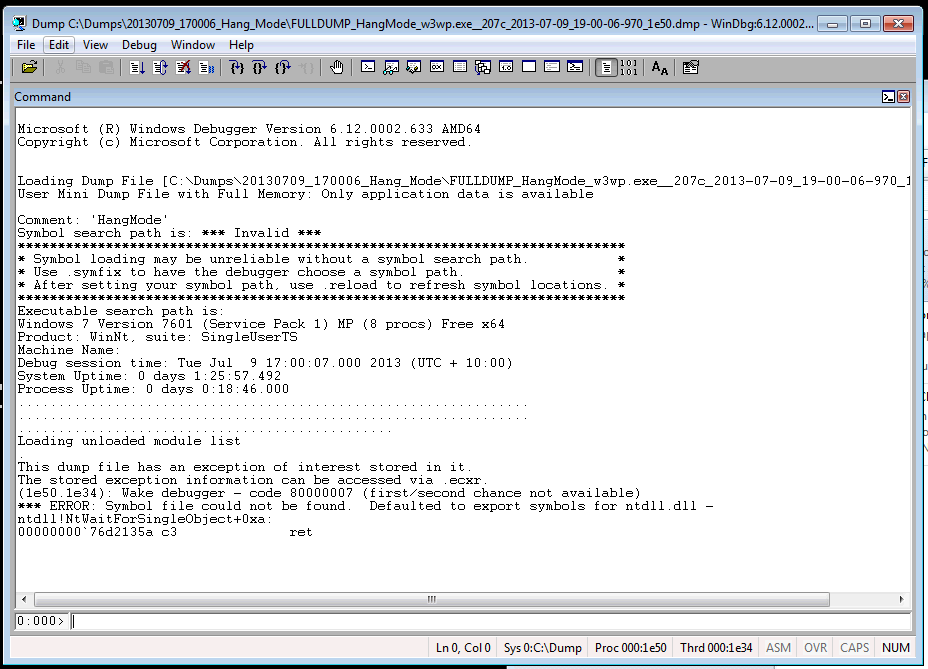
2. Goto File -> Open Crash Dump. You should then see something similar to the following:

3. Set the symbol path:
4. Load the .Net CLR


I used it in the past when diagnosing why a website was performing poorly during peak periods. Users would hit the website url, wait for 30+ seconds and then the site would appear quickly. Even the home page which did nothing (i.e. no db hits), was slow to appear.
I got a memory dump from the server and using the analysis approach below could see that all available IIS worker threads were in use and all were busy rendering. The server was starved of threads and user requests were ending up in a queue waiting to be processed.
I tweaked the IIS settings and added more worker threads. The problem went away. Thanks Windows Debugger!
How do you to get a memory dump?
1. Open a command prompt2. Get the list of worker process ids:
- %systemroot%\system32\inetsrv\APPCMD list wps
- This is a useful page describing how AppCmd works: http://www.iis.net/learn/get-started/getting-started-with-iis/getting-started-with-appcmdexe
- Your worker process should be in the list
- cd C:\Program Files (x86)\Windows Kits\8.0\Debuggers\x86 4. Create a directory for the memory dump. I went with c:\dumps
- ADPlus -Hang -p xxxx -quiet -o c:\dumps. You'll end up with a .dmp file in the c:\dumps folder.

Opening the memory dump in WinDBG
1. Run WinDBG. You'll see something similar to the following:2. Goto File -> Open Crash Dump. You should then see something similar to the following:
3. Set the symbol path:
- .sympath srv*c:\Symbols*http://msdl.microsoft.com/download/symbols
- .symfix
- .reload
4. Load the .Net CLR
- .Net 3.5: .loadby sos mscorwks
- .. or for .Net 4.0: .loadby sos clr
Working out what each of the threads are doing
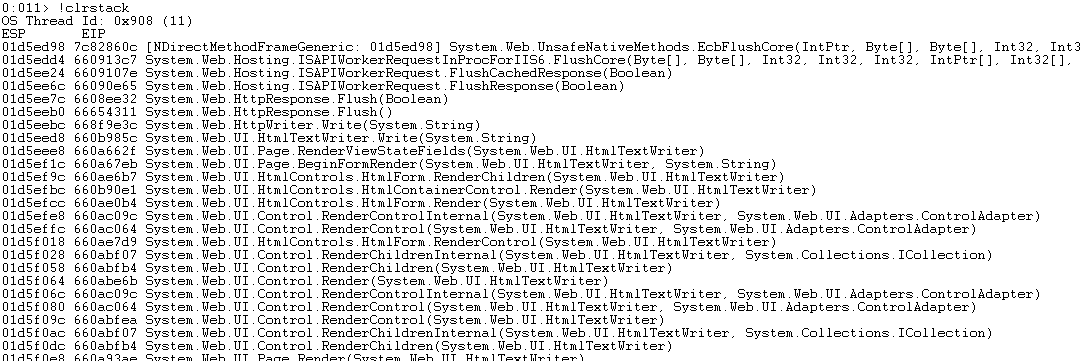
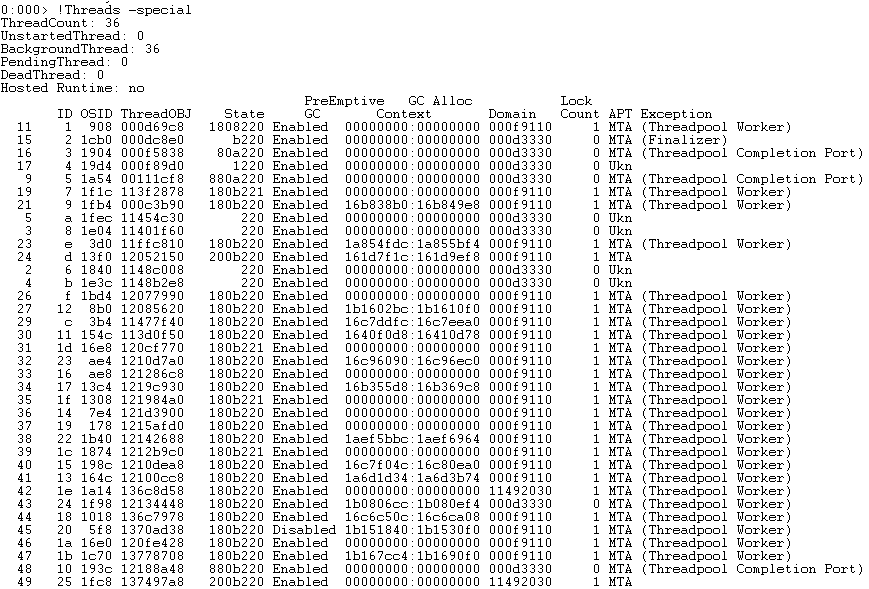
1. Get the list of threads in the memory dump- !Threads -special
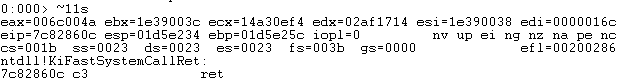
- ~11s
- !clrstack